The Client Revenue Report shows you how much revenue each of your clients has generated over a time period. It helps you understand who your most valuable clients are and how your revenue is distributed.
Opening the report
- 1
Go to Reports, then the Clients tab
Click Reports in the sidebar and choose the Clients tab.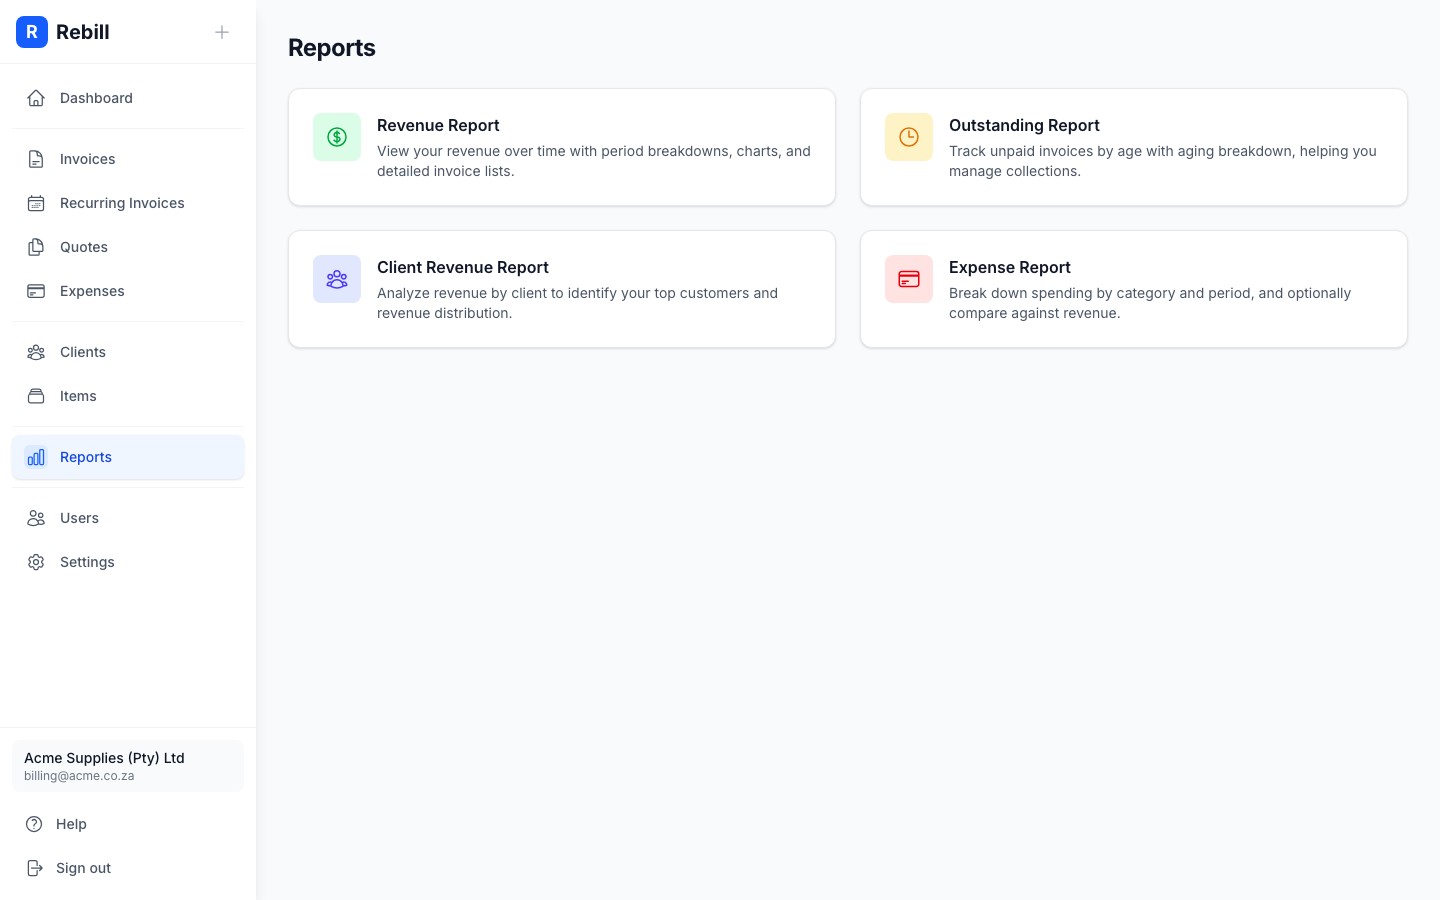
Setting the date range
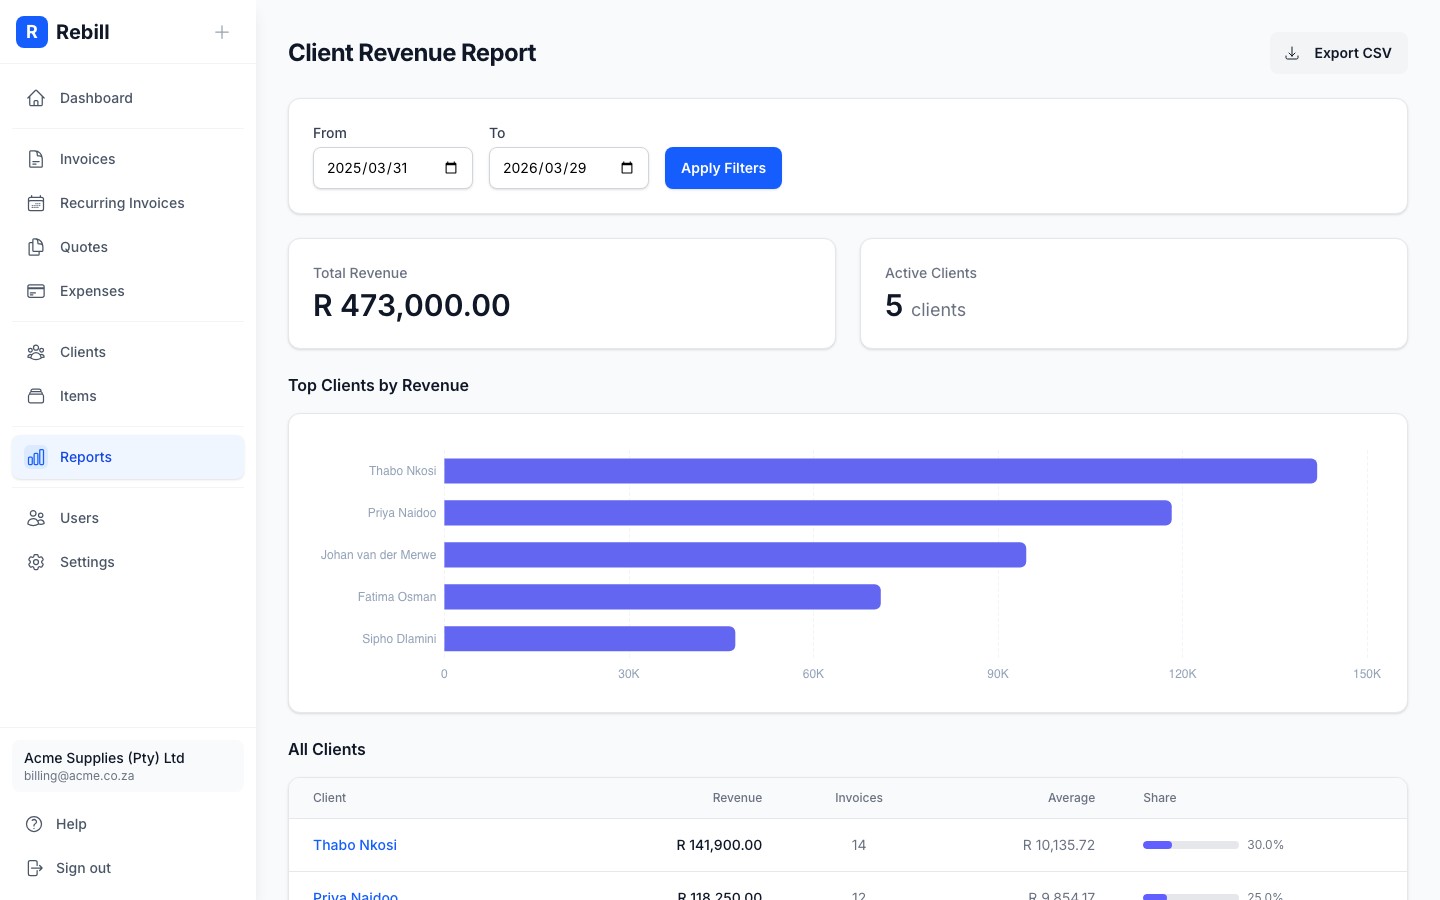
Use the Filters at the top to set a date range, then click "Apply".
Quick ranges
Instead of picking dates by hand, use the "Quick ranges" dropdown next to the date fields to jump straight to This month, Last month, Year to date, This fiscal year, Last fiscal year, Last 6 months, or Last 12 months. The two fiscal year options use your account's fiscal year start month. See Setting your business timezone and fiscal year to change it.Reading the report
The report has three sections:
- Summary stats: Total Revenue and the number of Active Clients in the period
- Top clients chart: a bar chart of your top 10 clients by revenue, so you can instantly see who your biggest spenders are
- All clients table: every client listed with their total revenue, number of invoices, average invoice value, and Share (a progress bar showing what percentage of your total revenue that client represents)
Tip
Click a client's name in the table to go directly to their client page. Click "Export CSV" to download the data as a spreadsheet.