The Summary Report pulls your revenue, expenses, and net profit together with the full list of invoices and expenses for a date range, in a single document. It is the report to reach for when you want one PDF that covers everything, rather than switching between the individual reports.
Opening the report
- 1
Go to Reports, then the Summary tab
Click Reports in the sidebar and choose the Summary tab.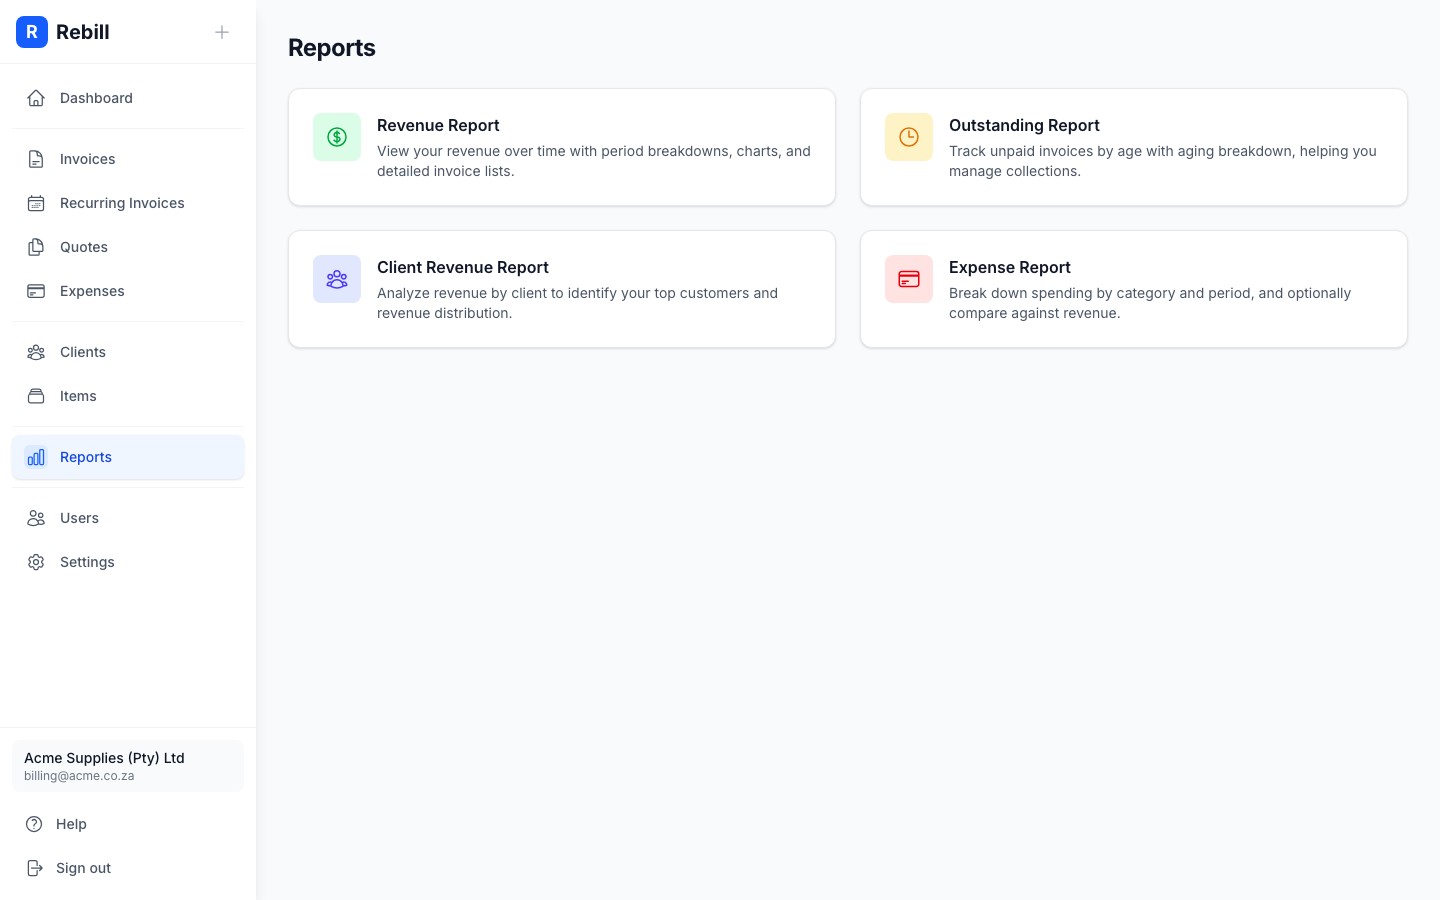
Setting the date range
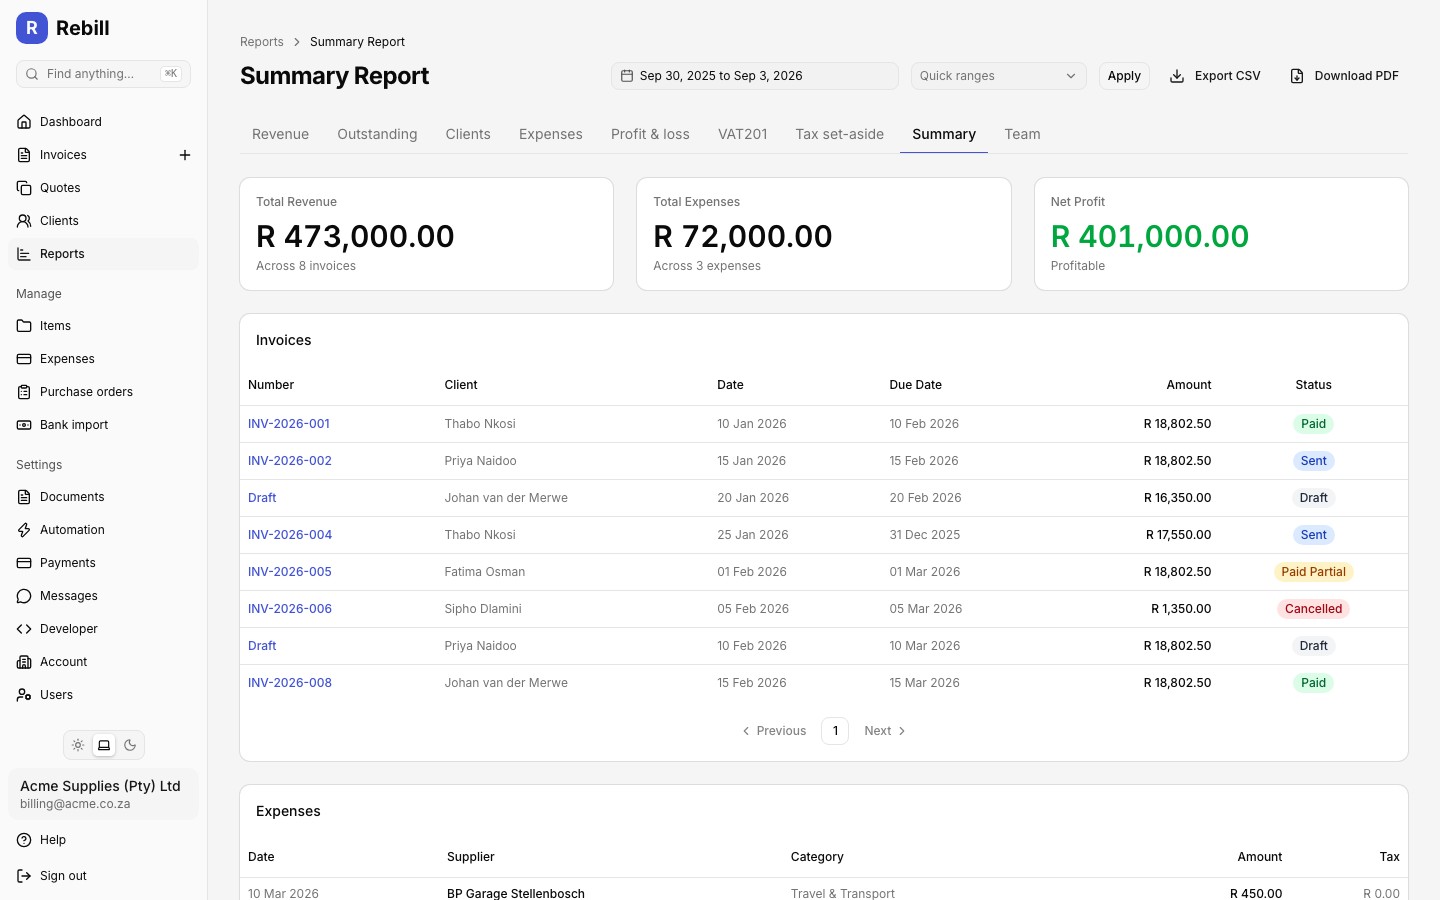
Use the Date range picker at the top to set a period (it defaults to the last 12 months), then click "Apply". Use the "Quick ranges" dropdown next to it to jump to This month, Last month, Year to date, This fiscal year, Last fiscal year, Last 6 months, or Last 12 months instead of picking dates by hand.
Reading the report
Three summary cards show Total Revenue, Total Expenses, and Net Profit for the period. If your account has activity in more than one currency, a By currency table appears below the cards splitting all three figures per currency.
Below that, two full tables list every invoice (number, client, date, due date, amount, status) and every expense (date, supplier, category, amount, tax) in the period, each paginated.
Downloading a PDF
Click "Download PDF" at the top right for a printable, brandable summary you can save or email, for example to your accountant or a business partner. Click "Export CSV" for the raw summary, invoice, and expense data instead.