The Revenue Report shows you all the money you've collected over any date range, broken down by period. It's the best place to understand your income trends and see how your business is performing over time.
Opening the report
- 1
Go to Reports, then the Revenue tab
Click Reports in the sidebar and choose the Revenue tab.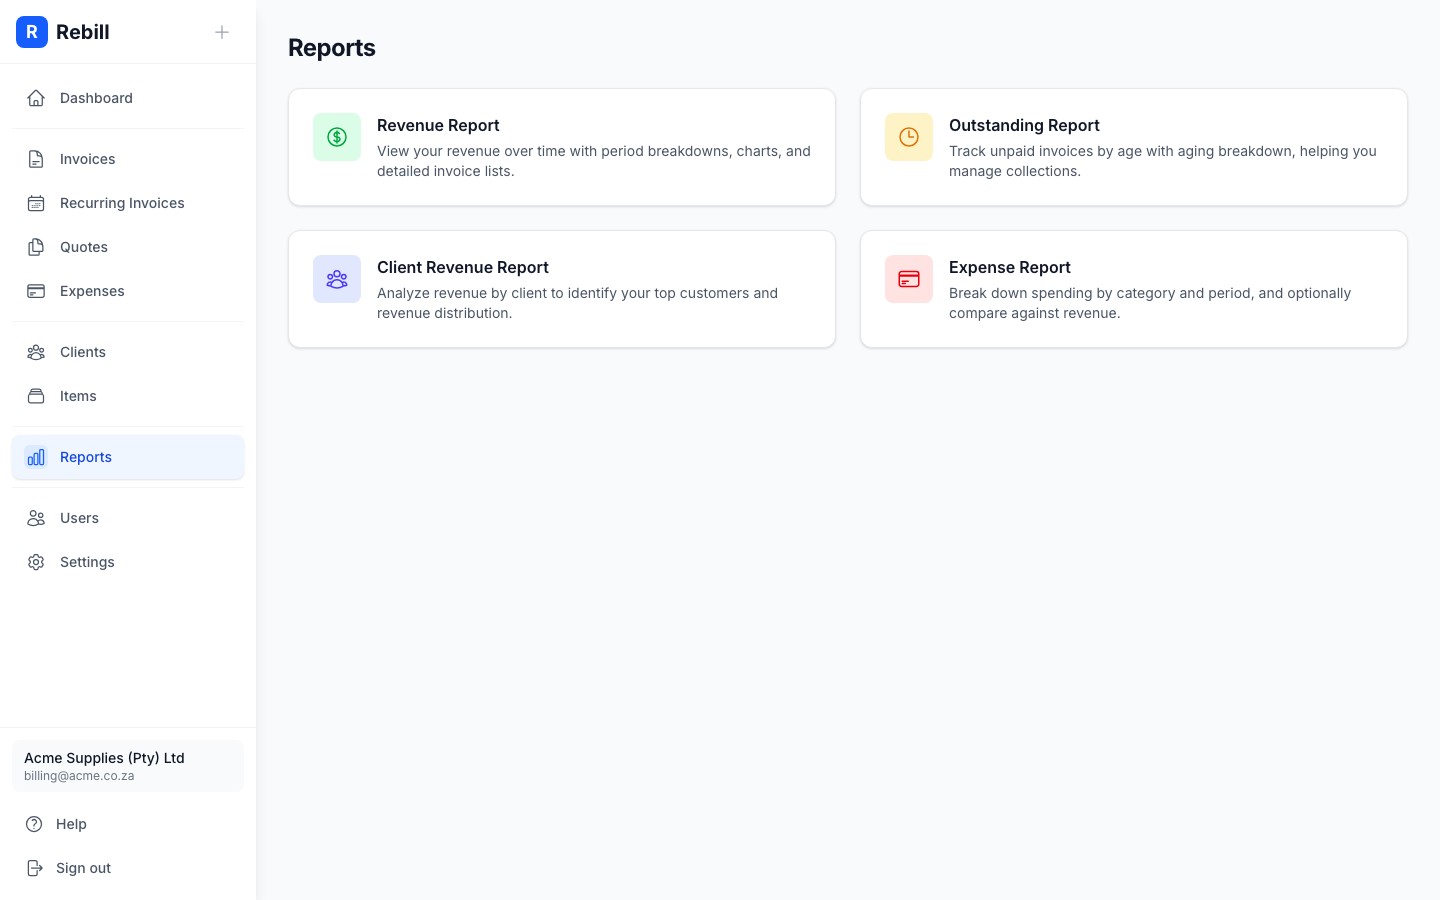
Setting the date range
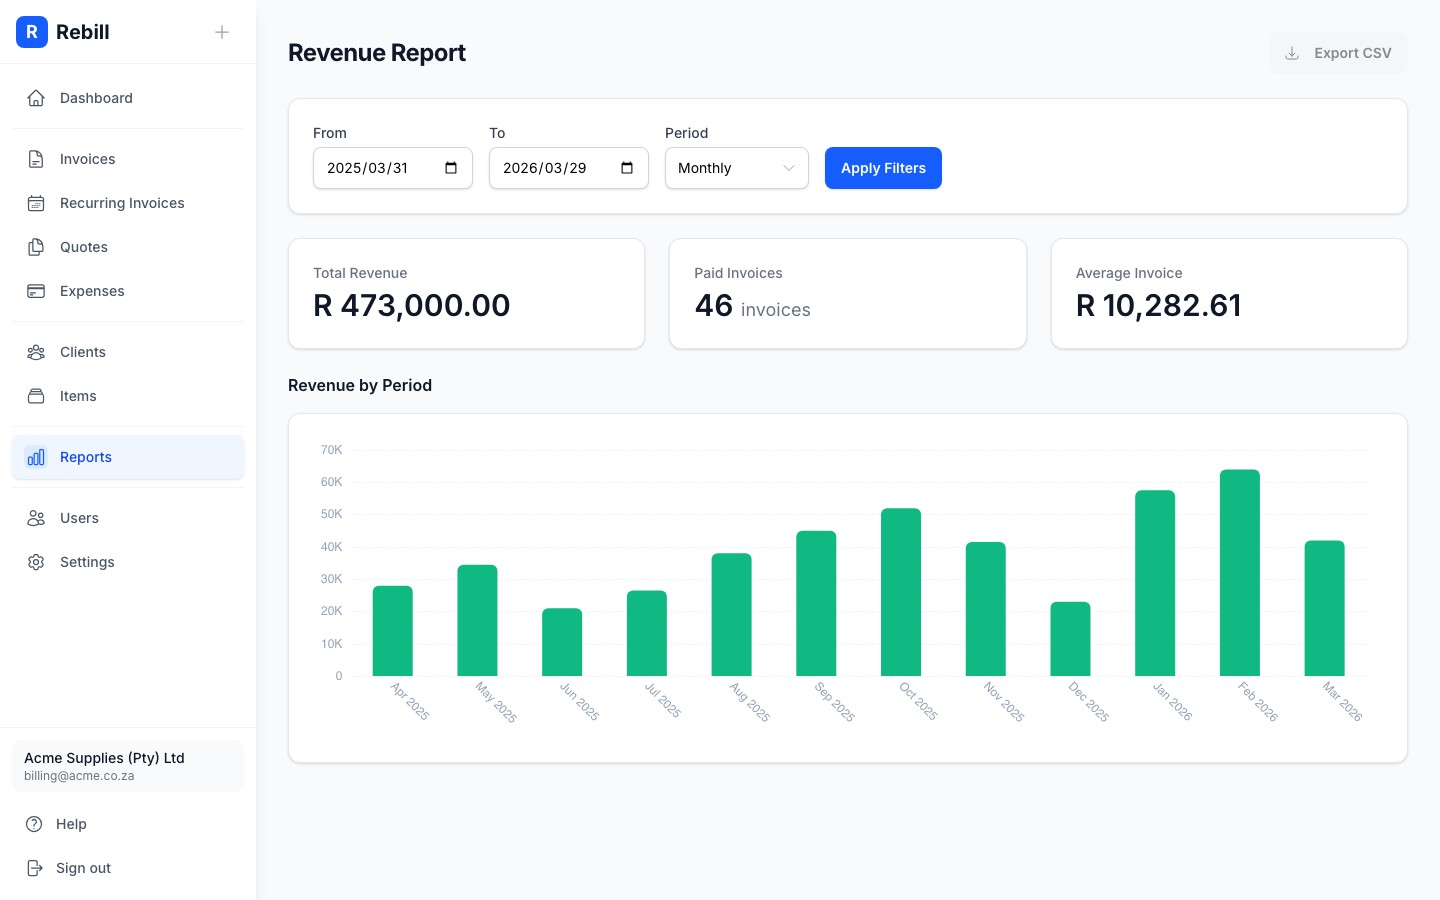
At the top of the report, use the Filters section to set:
- From and To dates: the period you want to analyse
- Period: whether to group data by Month, Quarter, or Year
Changing the period or ticking a box reloads the report straight away. After changing the dates, click "Apply".
Quick ranges
Instead of picking dates by hand, use the "Quick ranges" dropdown next to the date fields to jump straight to This month, Last month, Year to date, This fiscal year, Last fiscal year, Last 6 months, or Last 12 months. The two fiscal year options use your account's fiscal year start month. See Setting your business timezone and fiscal year to change it.Reading the report
The report shows three summary figures at the top:
- Total Revenue: the total amount received across all paid invoices in the period
- Paid Invoices: how many invoices were paid in the period
- Average Invoice: the average value of a paid invoice
Below that, a chart shows your revenue broken down by the period you selected (monthly bars, quarterly bars, etc.).
At the bottom, a table lists every paid invoice included in the report, with the invoice number, client, date, and amount.
Exporting to CSV
Click "Export CSV" at the top right to download the paid invoices table as a spreadsheet. This is handy for sharing with your accountant or importing into other software.