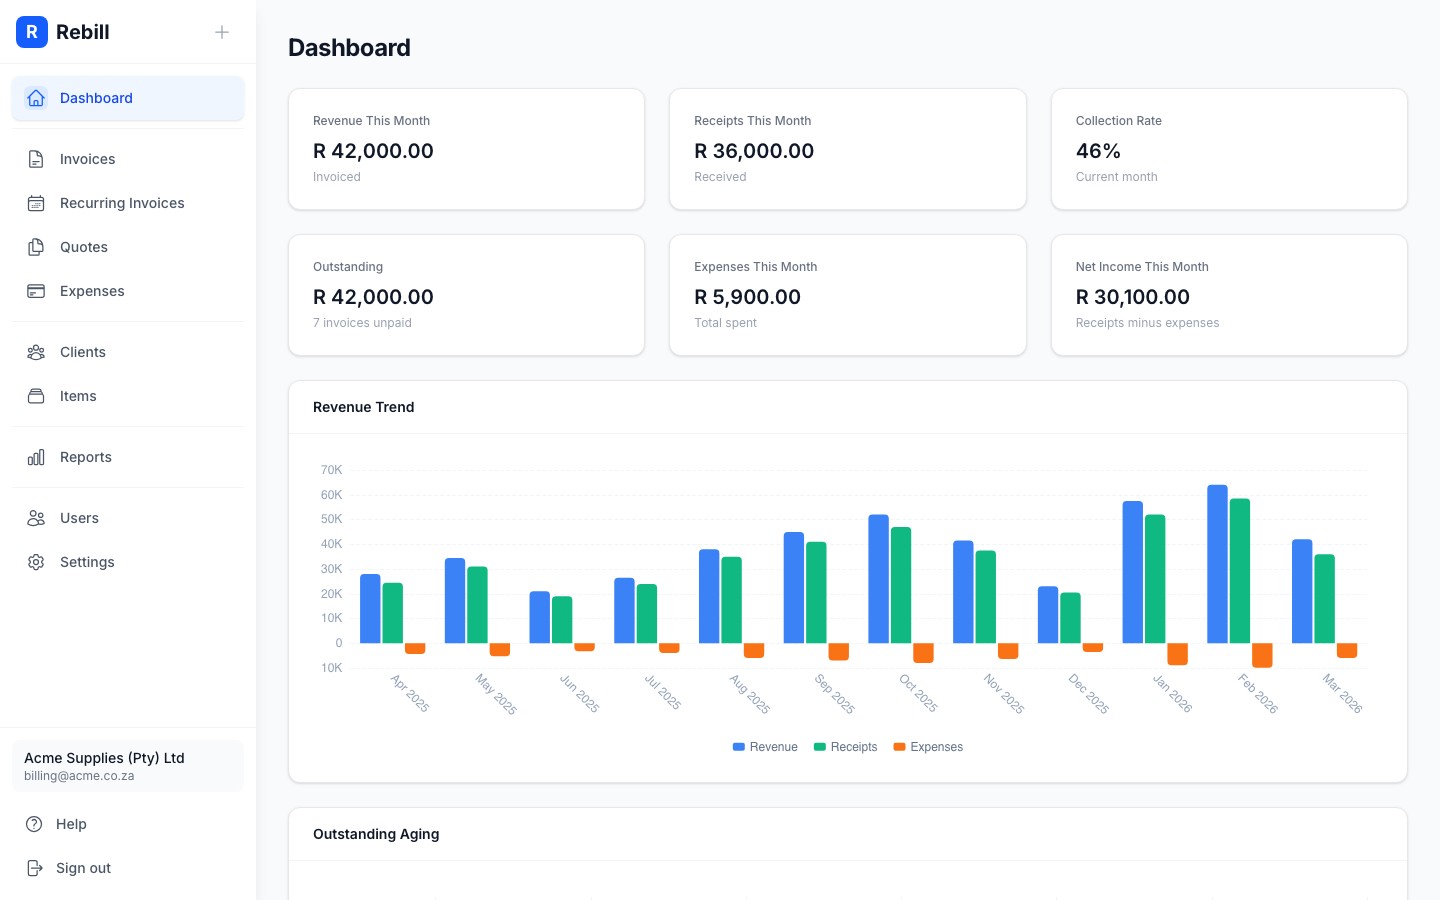
The dashboard is the first thing you see when you log in. It gives you an instant snapshot of how your business is performing: how much you've invoiced, how much you've collected, and what's still outstanding.

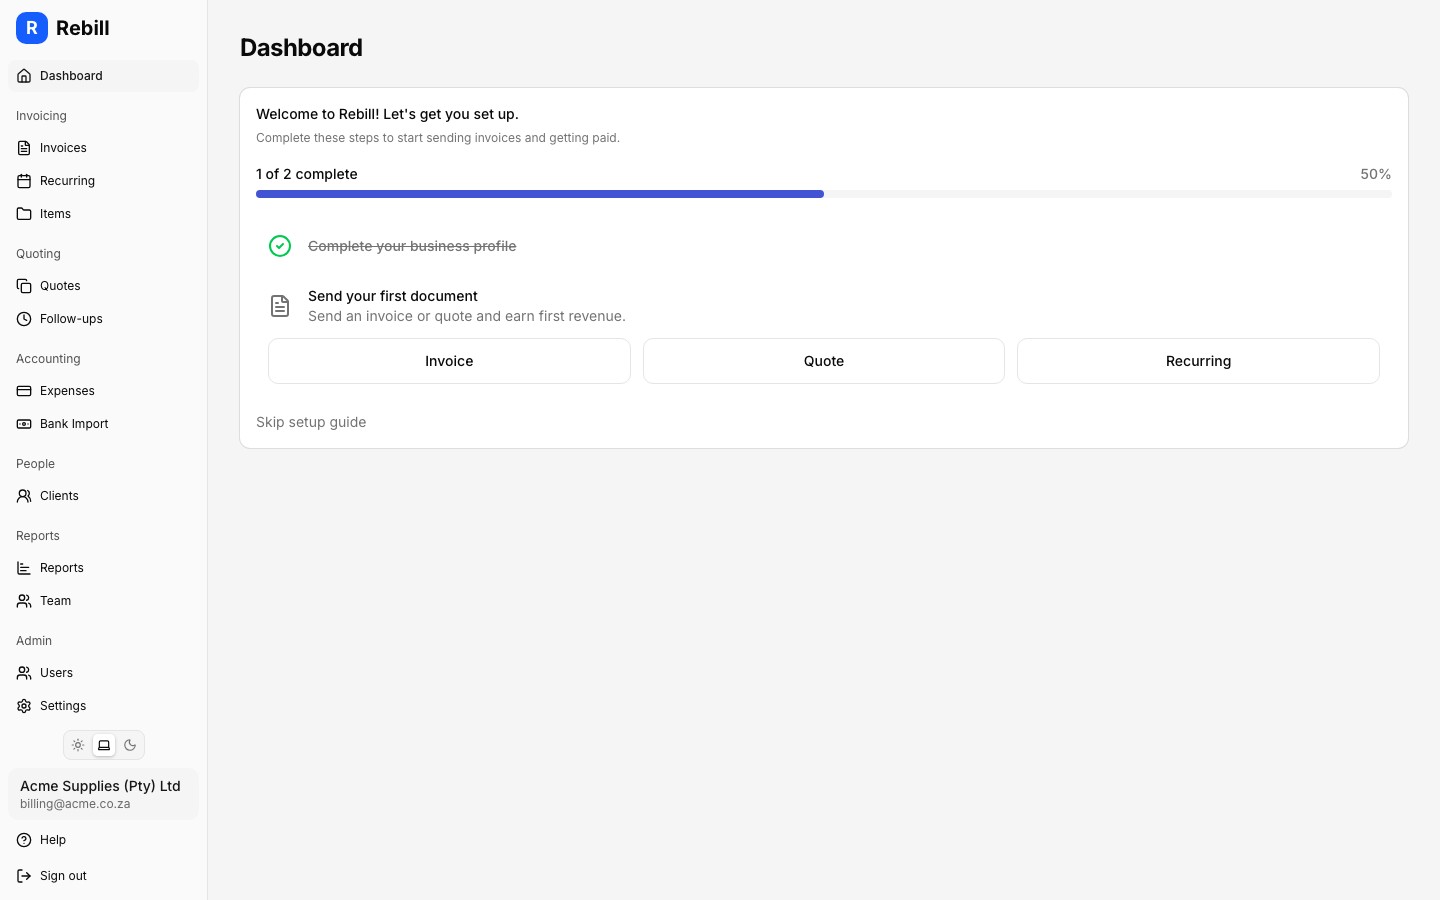
Setup checklist
The numbers at the top
There are five key figures shown at the top of your dashboard:
- Revenue This Month: the total value of all invoices you created this month, regardless of whether they've been paid yet.
- Receipts This Month: the total amount of money you've actually received this month (recorded payments on invoices).
- Collection Rate: the percentage of invoiced money you've collected. A higher number means you're collecting what you're owed more efficiently. For example, 80% means you've collected 80 cents of every rand you've invoiced.
- Outstanding Invoices: the number of invoices that haven't been fully paid yet.
- Outstanding Amount: the total rand value of all unpaid invoices combined.
Multiple currencies
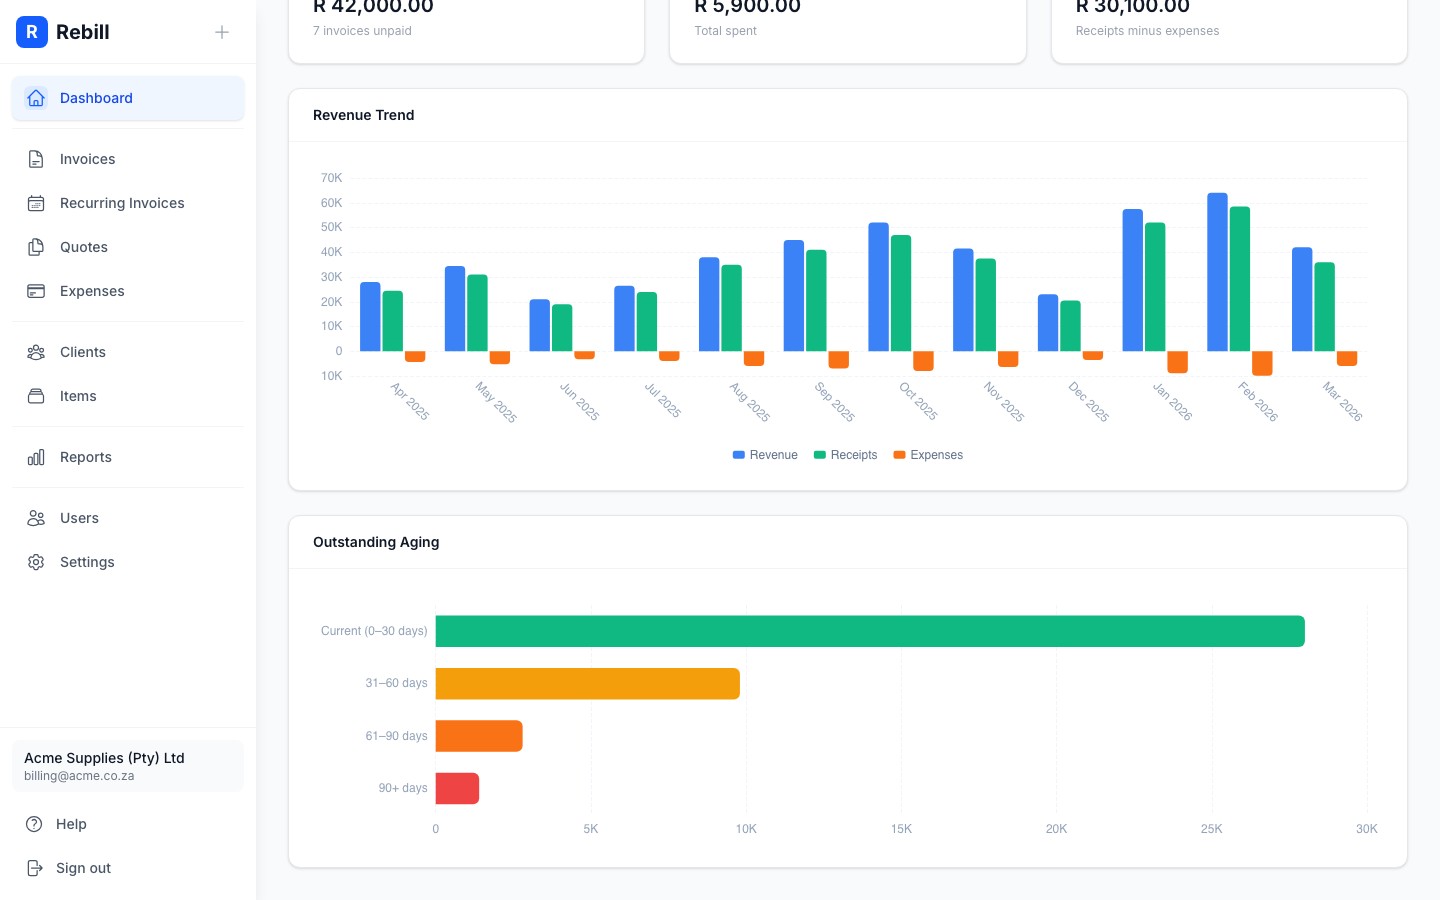
If you invoice clients in more than one currency (e.g. ZAR and USD), each currency's figures are shown separately. You'll see stacked amounts for each.Revenue Trend chart
Outstanding Aging chart
The aging chart groups your unpaid invoices by how overdue they are:
- Current (0 to 30 days): invoices that are within their payment terms, or only slightly overdue. These are the easiest to collect.
- 31 to 60 days: invoices that are getting old. A gentle follow-up is usually enough.
- 61 to 90 days: invoices that need attention. Consider sending a firm reminder.
- 90+ days: invoices that are seriously overdue. You may want to follow up by phone or escalate collection.
The bigger the bar in the older buckets, the more urgently you need to chase payments.
Below the chart you will see a list of every non-zero bucket with the invoice count and outstanding amount. Click any bucket to jump to the invoice list filtered to that age range. It is the fastest way to go from "I need to chase overdue clients" to a list of the specific invoices to follow up on. The View all outstanding link in the card header takes you to every unpaid invoice at once.