The Expense Report shows your spending broken down by category and by period. You can set a date range, group by month, quarter, or year, and optionally include a profit summary that compares your expenses against invoiced revenue.
Opening the report
- 1
Go to Reports → Expense Report
Click Reports in the left sidebar, then click "Expense Report".
Filters
At the top of the report, set your filters:
- From / To — the date range to analyse
- Period — group data by Monthly, Quarterly, or Yearly
- Include profit summary — tick this to add a Net Profit card showing revenue minus expenses for the period
Click "Apply Filters" to refresh the report.
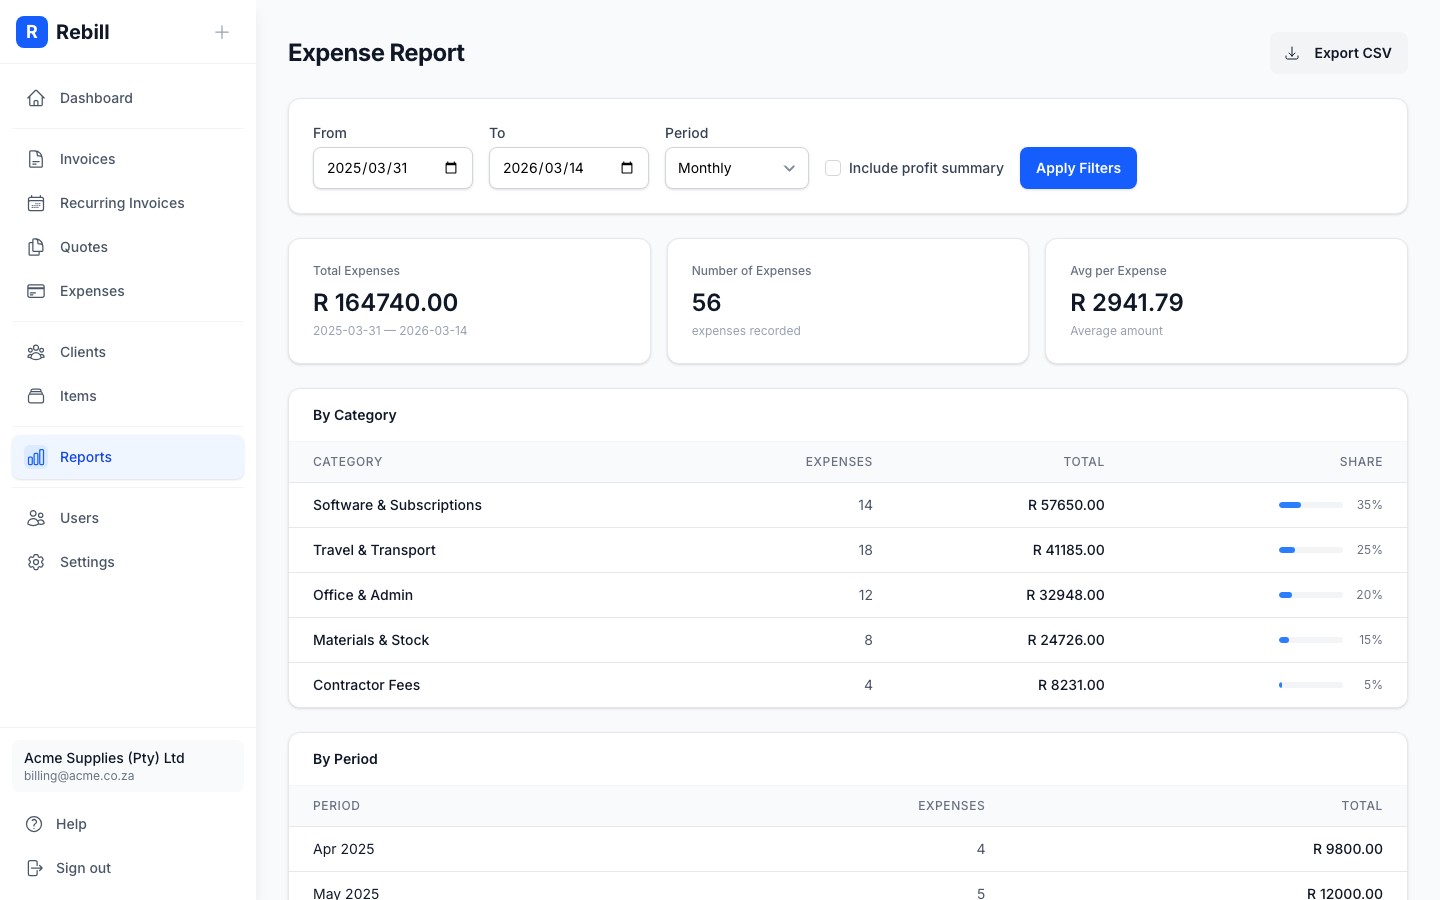
What the report shows
Three summary cards at the top show:
- Total Expenses — total amount spent in the period
- Number of Expenses — how many expense records were logged
- Avg per Expense (or Net Profit if profit summary is enabled)
Below the cards, two tables break down your spending:
- By Category — each category with total, count, and share of total spend
- By Period — spending grouped by the period you selected

Tip
Click "Export CSV" to download the category breakdown as a spreadsheet — useful for sharing with your accountant.